How to Make a Graph in Adobe Illustrator
You can use the vector-based software normally reserved for designers and artists to make and edit charts.
Most of us create graphs with actual graphing software. Maybe it’s Microsoft Excel. Maybe it’sR. Whatever it is though it’s usually specialized for analysis. What if you want to make a graphic for a publication or a presentation that’s polished and fully customized? Adobe Illustrator gives you the control you need to do this. It’s not graphing software. It’s illustration software, but once you get the hang of things, Adobe Illustrator can be a valuable tool in your visualization arsenal.
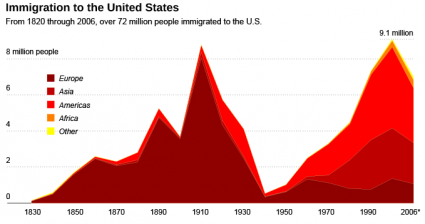
In the rest of this post, I’ll go over the steps to make the above graph in Illustrator. I used the U.S. immigration data from our recent contest.
